Google Ads and Facebook Ads with Windsor.AI connector
Data analysis is key to digital marketing and Power BI is a great tool for this. But why connect our Facebook and Google ads separately to Power BI instead of just using Google Analytics? In this article, we'll show you how to go beyond Google Analytics' capabilities and connect ad accounts directly to individual reports to generate custom reports.
The first and most important reason why this is an important area of analytics is that Facebook and Google ads run on different platforms. Google ads are usually displayed on search engines and the Display network, while Facebook ads are displayed on social media platforms. As a result, the data they generate will be different. If we only use Google Analytics, we will not see the performance of our Facebook ads and vice versa. However, Power BI allows you to track both platforms in one place and compare daily data.
The second reason is that Facebook and Google use different metrics. Google considers conversions and click-throughs as the most important, while Facebook measures success based on followers and ad views. But with Power BI, you can combine these different metrics to get a single view of how your ads are performing on both platforms. Our Facebook and Google ads tend to target different audiences. By analysing the data from both platforms separately, we can get a more accurate picture of which ads are performing better for different segments of our target audience. And Power BI makes it easy to aggregate and compare data and allocate available budgets more efficiently.
Since Power BI doesn't support Facebook Ads and Google Analytics 4 by default, I was looking for a 3rd party connector that could hopefully handle everything I wanted.
My choice was windsor.ai, which has everything I need at a reasonable price.
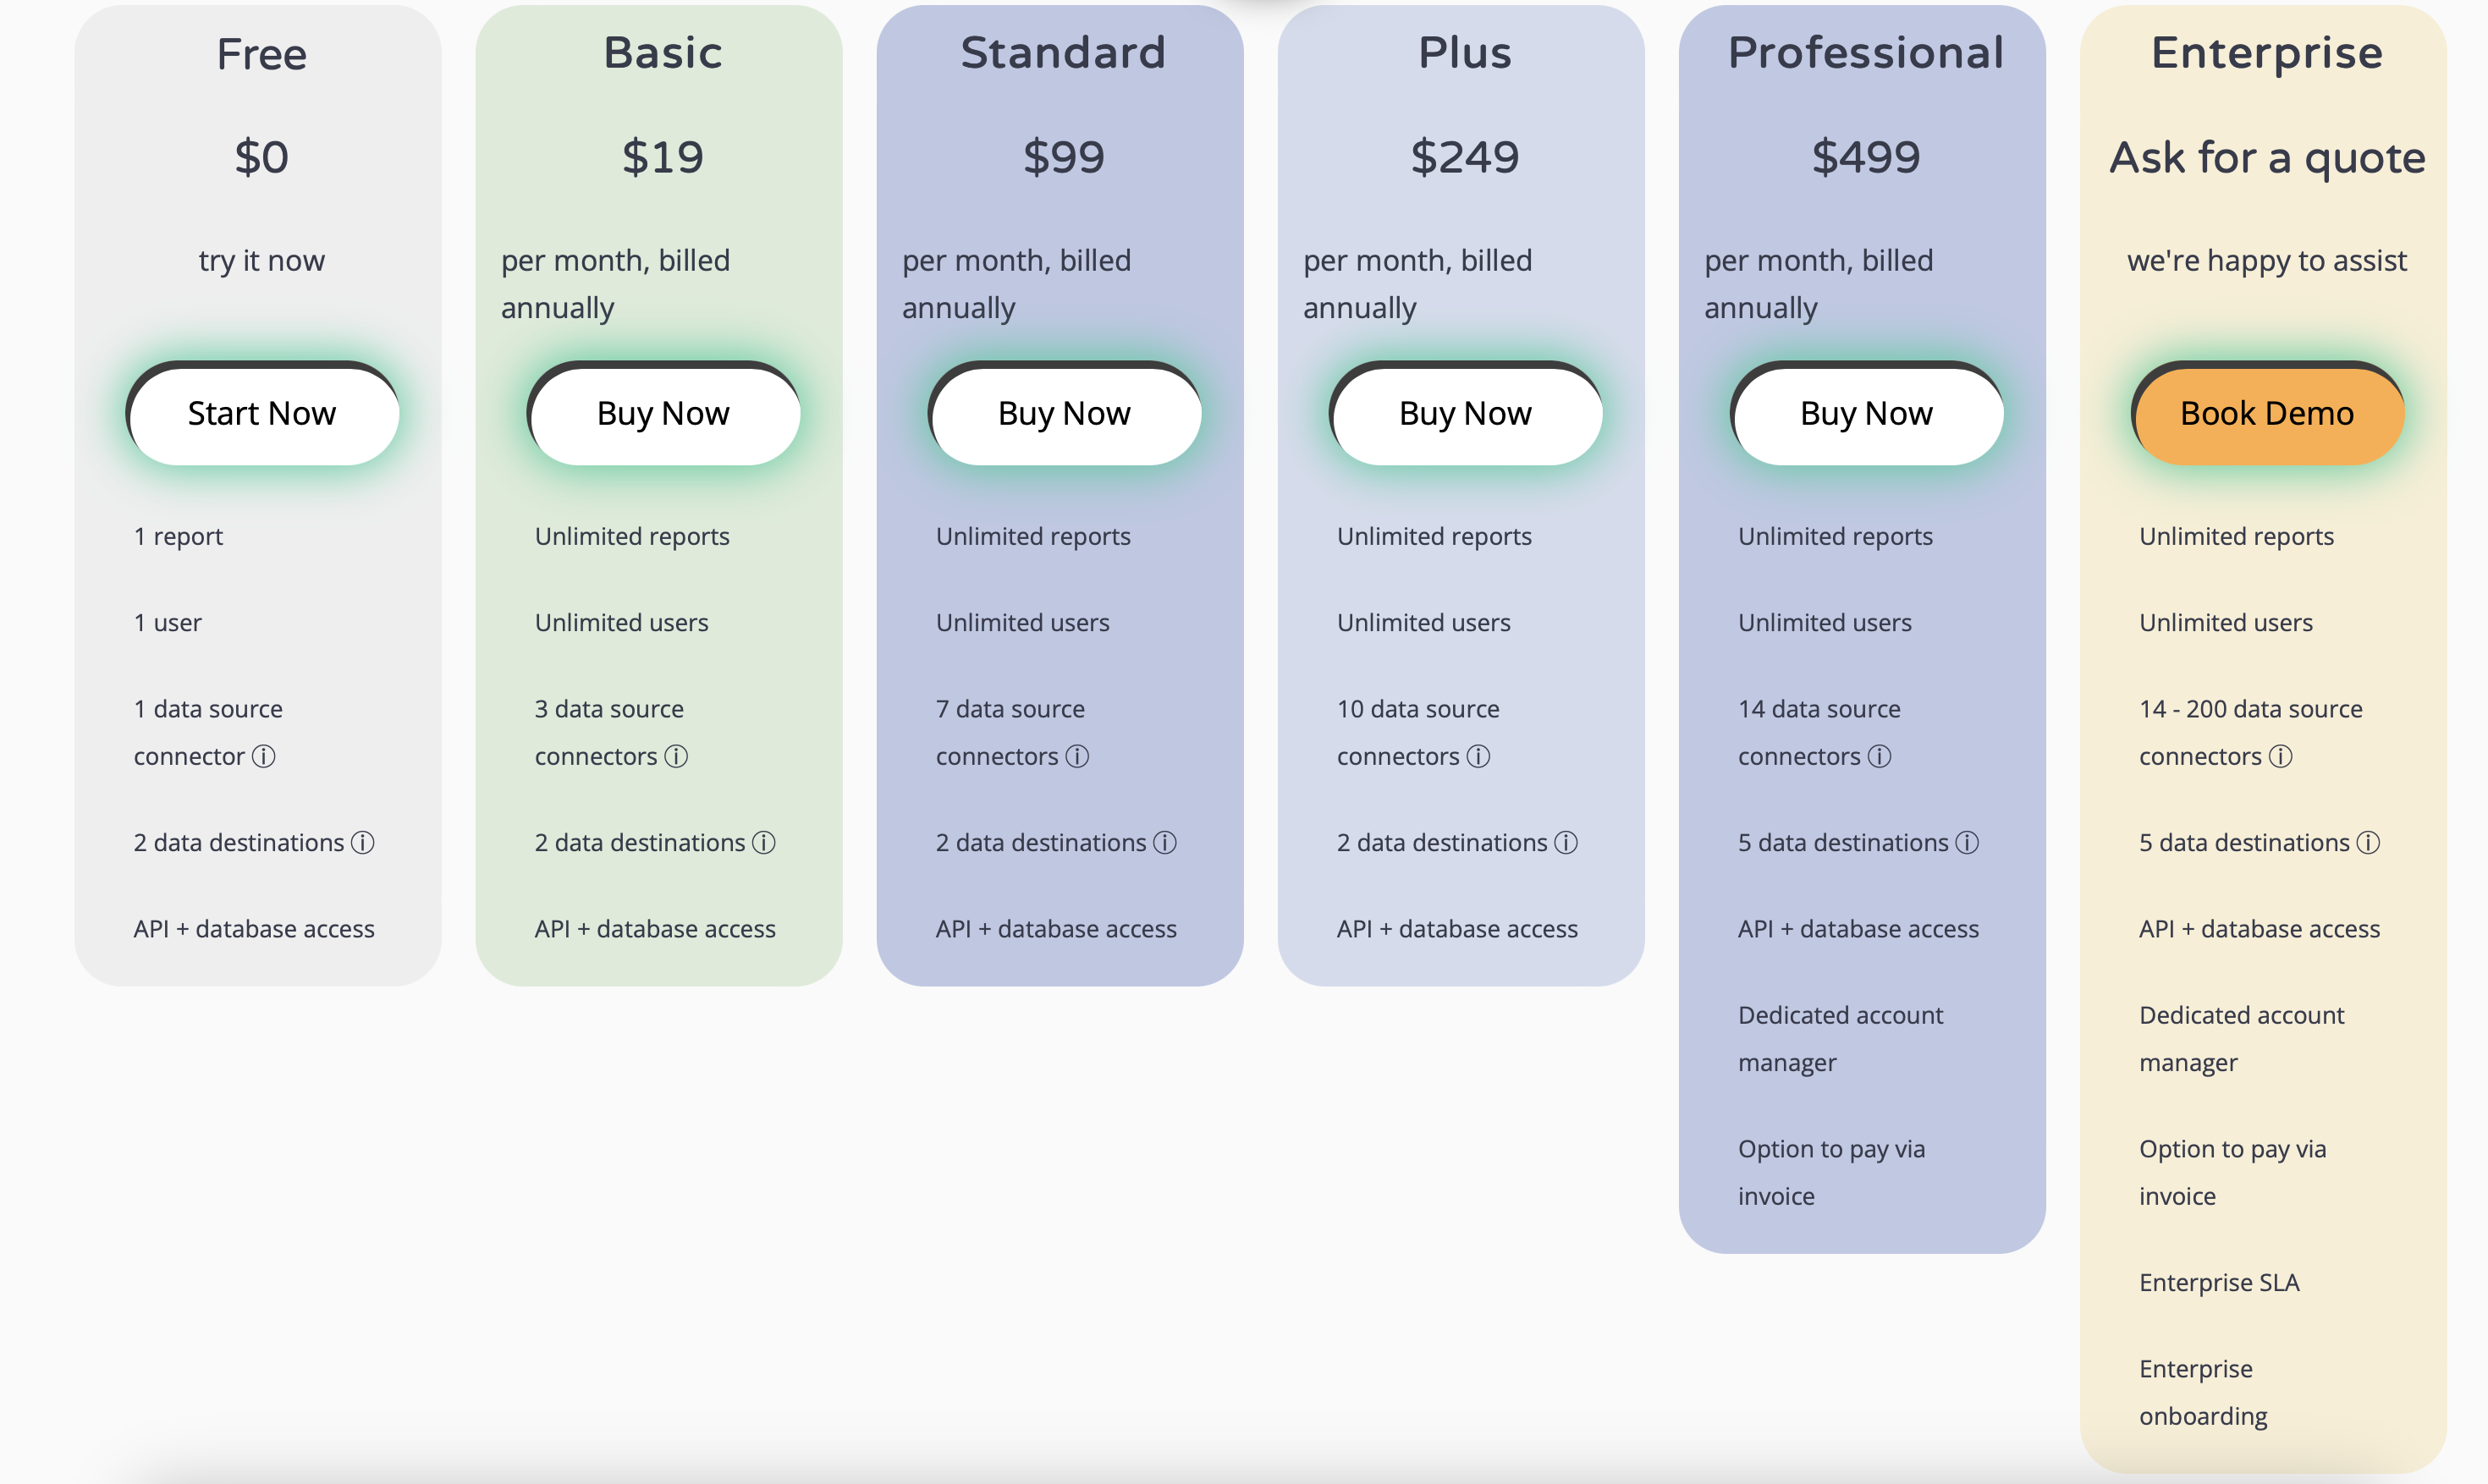
If someone wants to get started, they can try the free package first to see if what they have is right for them. Unfortunately, in this form we can only connect up to 1 month's data, but it's definitely worth testing the connector back and forth before pressing the pay button.
For my needs the 3 data source connectors were enough for now, so I paid for the smallest package, I will work with this package in the next ones.
For this exercise, I will need the following data sources:
- Google Analytics Universal
- Google Analytics 4
- Google Ads
- Facebook Ads
This is a campaign for a special service client, where we measure the sales of centres in different cities, with two types of conversions, one with an application (consultation) and one with an online purchase. The campaigns are organised separately per city in both Google and Facebook Ads. They are created as individual conversions on both platforms. Google Analytics conversion measurements are tricky in terms of individual conversions, in this case I will measure Google conversions from analytics and Facebook conversions from their Ads system. Of course, there are additional metrics that I want to put alongside these from Google Analytics and the other three. The data source says it will be as follows:
Google Ads:
- Account name
- Campaign name
- Clicks
- Impressions
- Date
- Source from
- Spent amount
Facebook:
- Account name
- Campaign name
- Ad set name
- Clicks
- Impressions
- Date
- Amount spent
- Conversions type no. 1
- Conversions type no. 2
Google Analytics and GA4:
- Ad Group
- Campaign
- Source/Medium
- Date
- Conversions type no. 1
- Conversions type no. 2
The GA4 swap is in progress, so I also connected it for the sake of testing, apparently it will be no problem to extract the same data from here and continue to add it to the UA data.
In the windsor.ai interface we can set up these data sources in several steps.
Step 1: Select data sources:
It supports quite a few types of data sources, apart from the ones I'd like to highlight above:
Youtube, Reddit, Salesforce, Adform, Pinterest, Quora, Shopify, Snapchat, Spotify, Tiktok and Twitter. Not bad.
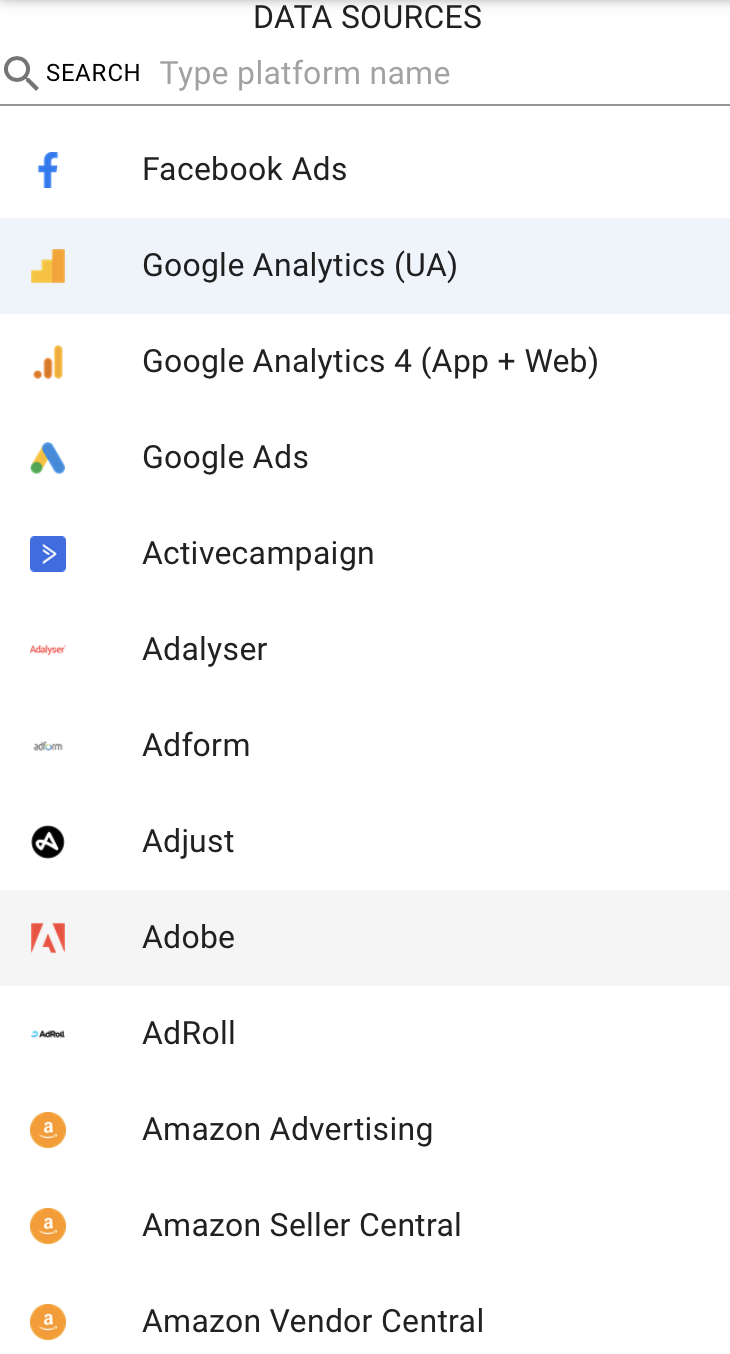
I can select each data source individually and enter the usual credentials. Once this is done, the name of the corresponding Account already logged in will appear in the slot below the address.
- Once you have entered the desired service, you can go to the data preview by clicking on the NEXT (DATA PREVIEW) button below.
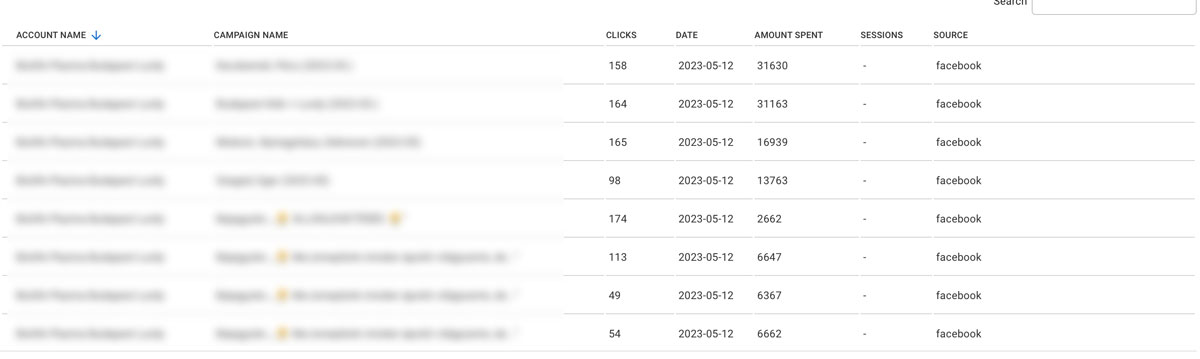
Here it basically loads a lot of data, but you have the option to select, exclude or add fields individually on the right. By selecting the Select Date Range option, we can choose which date range we want to examine. Unfortunately, in the free version, only the last 30 days are possible. It is of course also possible to specify a custom time range.
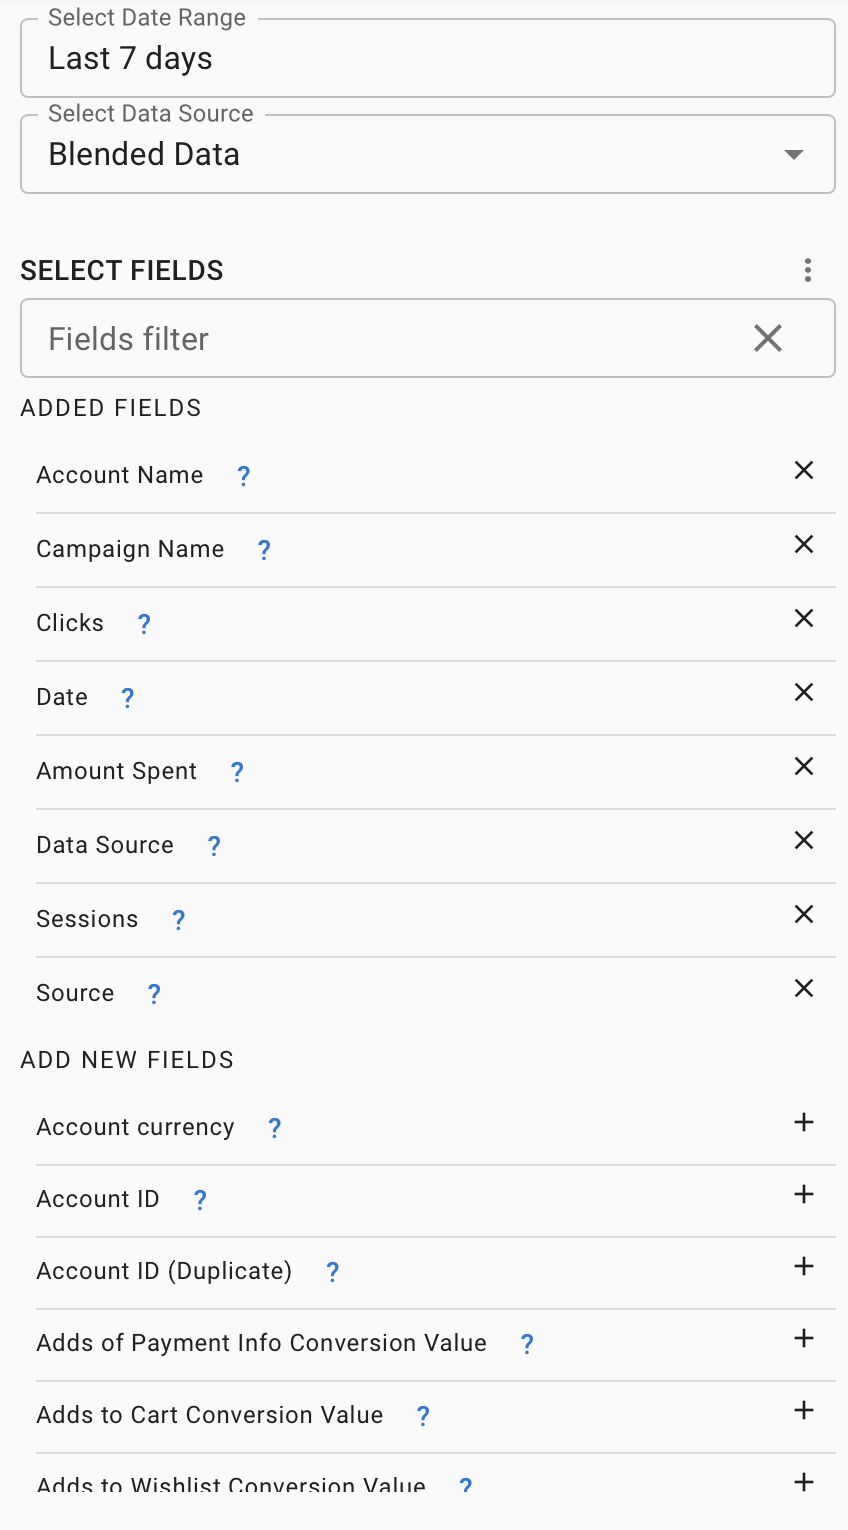
By pressing Select Data Source, you can move between each of the previously added data sources, or there is a fully merged view, Blended Data, where the system tries to combine them all into a single table. In my experience it hasn't always succeeded, so I've stuck with the separate data source exports.
-
Once you have good looking data, down in the Data destinations section you can choose where you want to import your extracted data. You can choose from the following options:
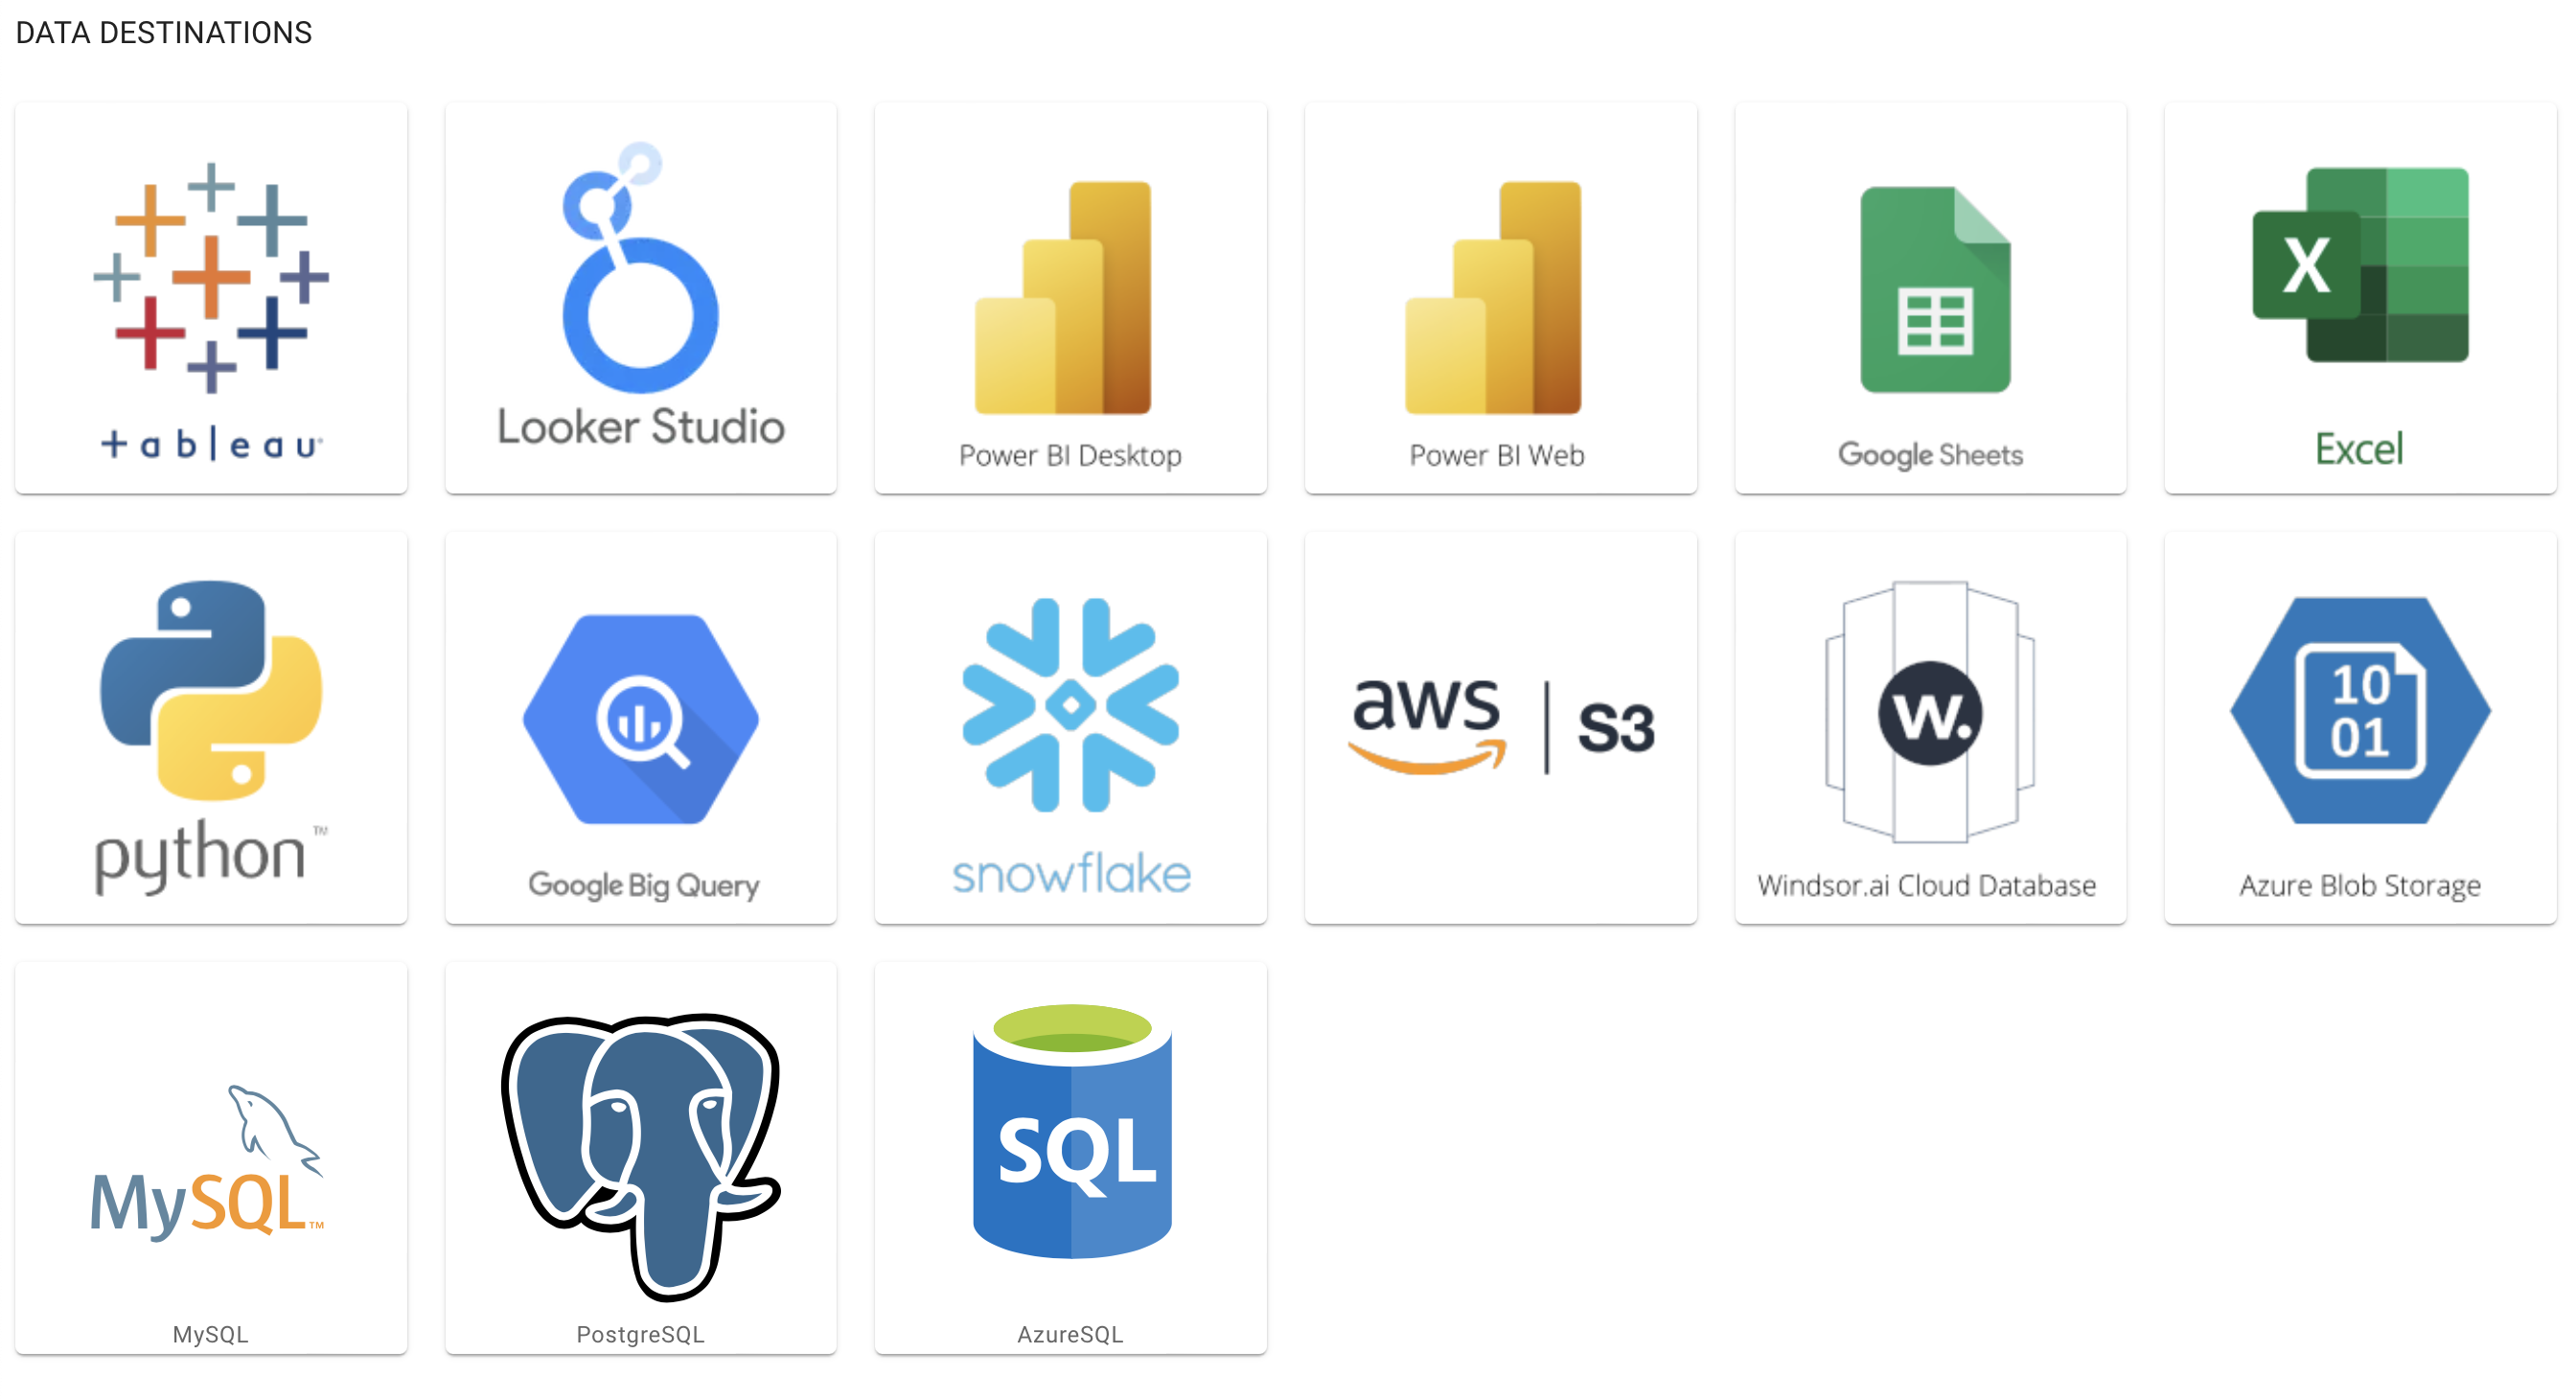
I chose the power BI desktop in this case, and it generated the JSON link nicely in the form below:
You can see that the URL contains the required field and other parameters, so you can manually change them afterwards, even in Power BI. So in total I will have 4 separate JSON links for the 4 data sources, I can add them one by one in Power BI as Web data sources. The rest is done in the usual way.
I will show you some pictures of the final result at the end:
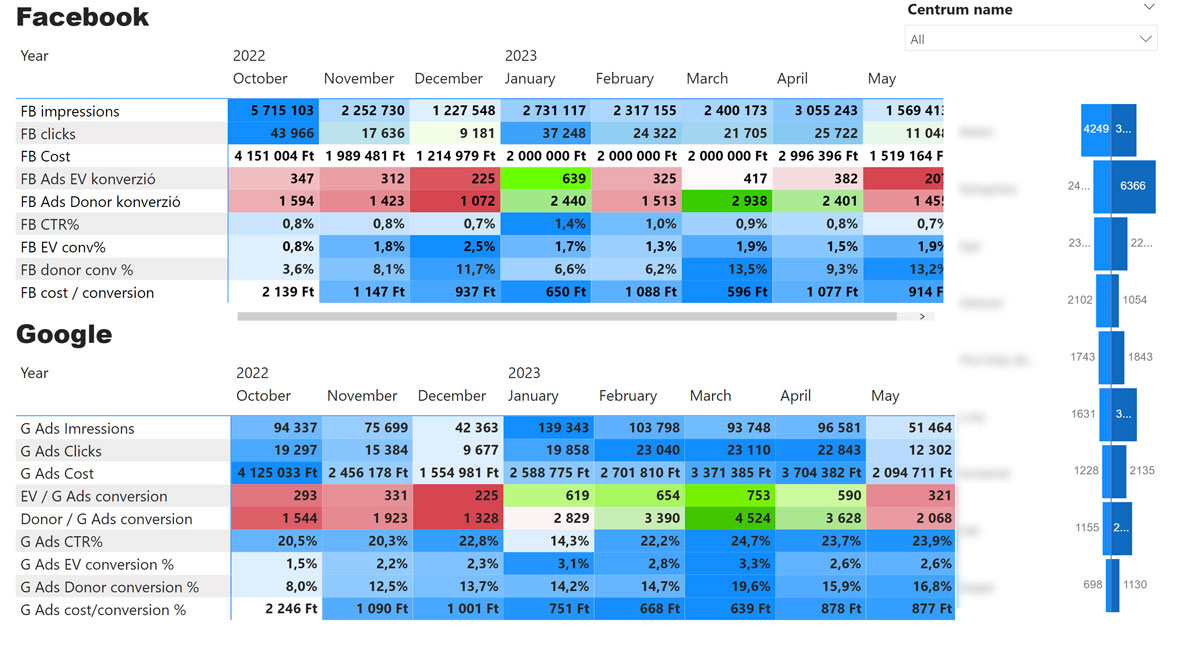
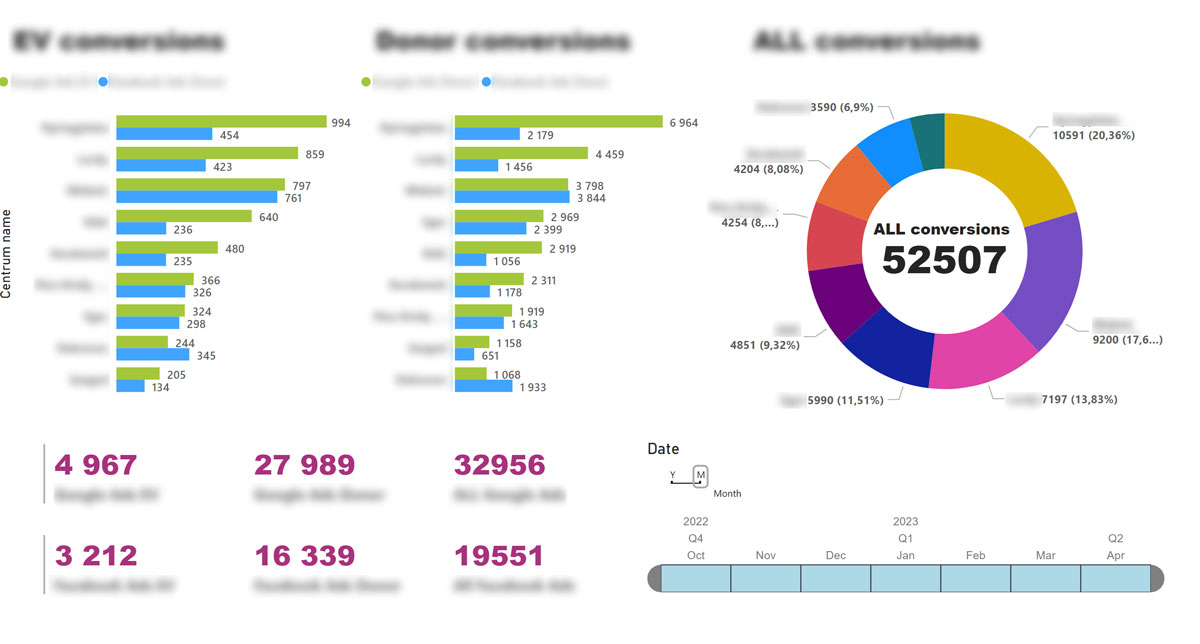
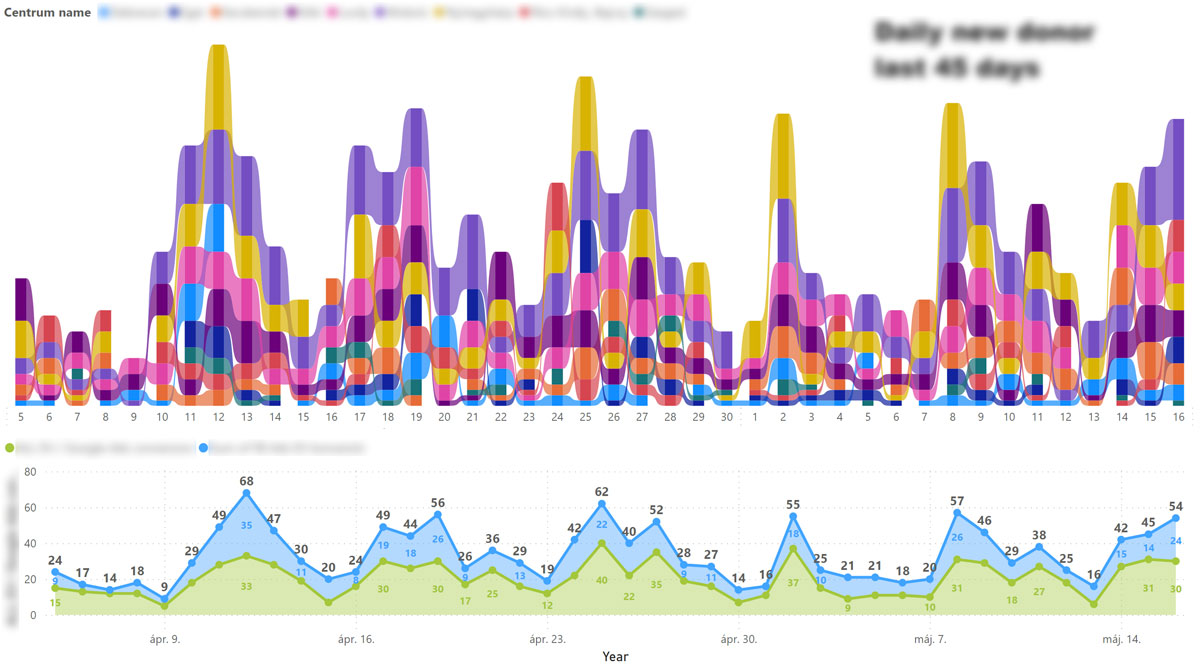
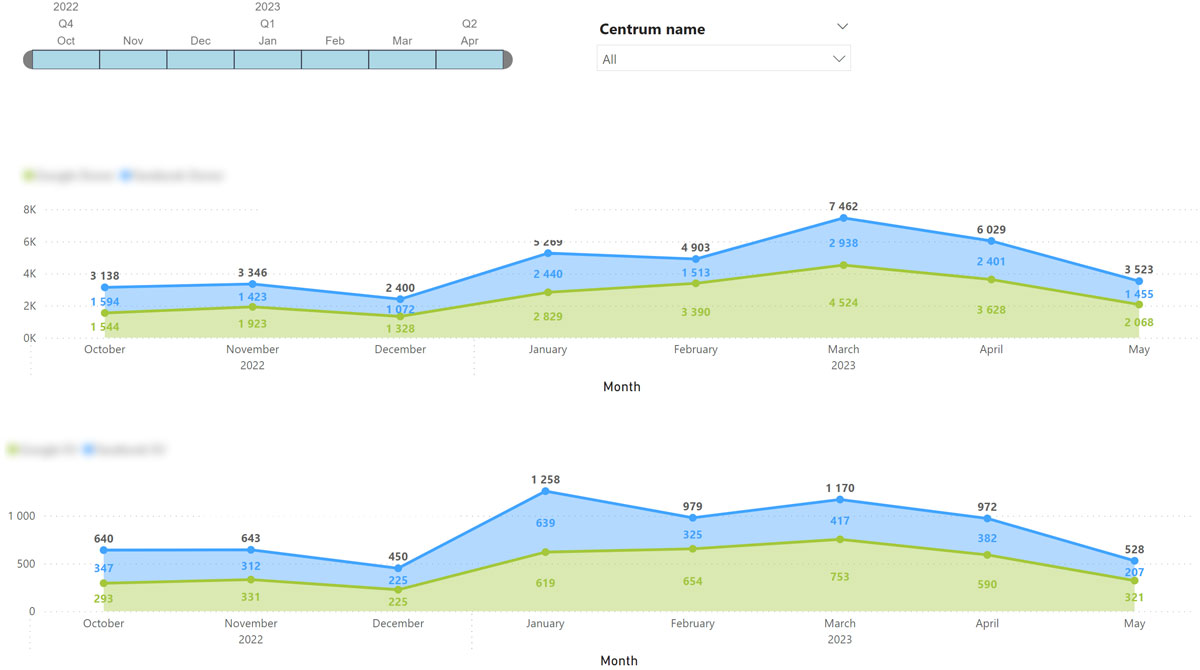
For me, the windsor.ai connector has been a great help to finally see conversion data in one place and in the format I want to see it. If you have a similar problem and have outgrown Google analytics views, don't hesitate to try it!